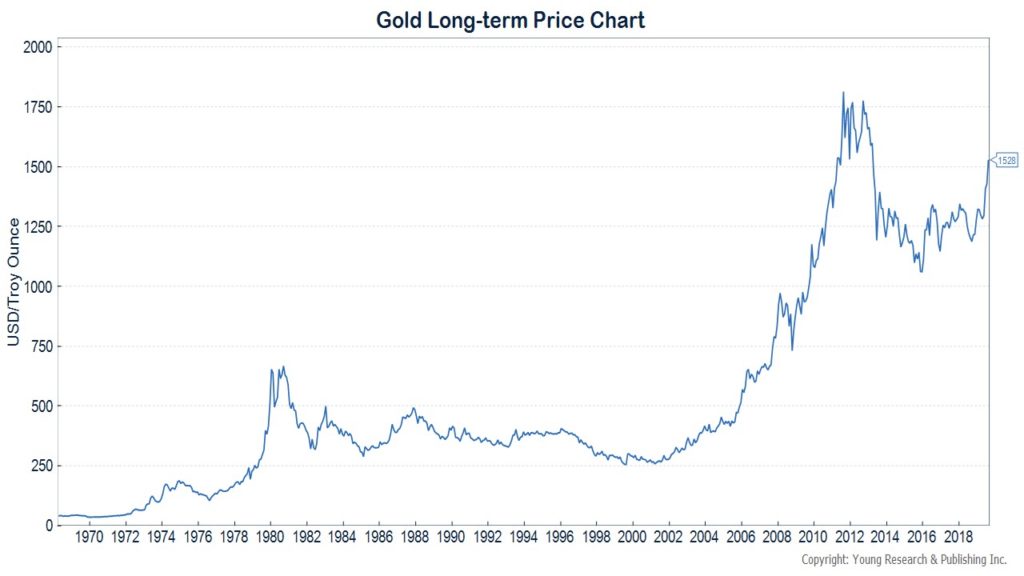
Since President Nixon closed the gold window in August of 1971, the price of gold has increased more than 37-fold. From a price of $40.65 at month-end August 1971, gold has risen to $1,528 today. A $1,000 investment in gold at the end of August 1971 would be worth over $37,000 today—a compounded annual return of 7.8%.
How Does Gold’s Return Compare to Stocks and Bonds?
Gold’s 7.8% return since August of 1971 compares favorably to the 7.4% return that intermediate-term U.S. Treasury securities delivered over the same time. More surprising to some is that gold has even appreciated more than stocks over this period. From August of 1971 through today, the S&P 500 index has increased at a 7.3% average annual rate. These numbers for the S&P exclude dividends and the reinvestment of dividends, but gold’s returns relative to stocks remain impressive for an asset that many consider to be the ultimate safe-haven.
Downside to Investing in Gold
The downside to investing in gold for some is that unlike bonds where the returns tend to be smoother, gold can experience long-dry spells. The table below compares the performance of gold to intermediate-term government bonds, and the S&P 500 (capital appreciation only). The 1970s were gold’s best decade with the price compounding at more than 35%, but over the next two decades, gold was down in price. Then during the 2000s, gold prices soared again rising at a 14.1% compounded annual rate. Stocks were down during the 2000s and bonds were up, but significantly underperformed gold. So far this decade, gold hasn’t performed as well as it did last decade, but it has kept pace with inflation and is only modestly lagging bonds.
Table of Historical Returns of Gold, Stocks, and Bonds by Decade
| Decade | Gold | Stocks | Bonds |
| 1970s* | 35.5% | 1.0% | 5.0% |
| 1980s | -2.5% | 12.6% | 12.3% |
| 1990s | -3.5% | 16.0% | 10.1% |
| 2000s | 14.1% | -2.7% | 6.7% |
| 2010s* | 3.6% | 10.5% | 4.8% |
| *1970s return starts in August 1971 and 2010s returns end in August 2019 | |||
The Reason Gold is a Good Long-term Investment
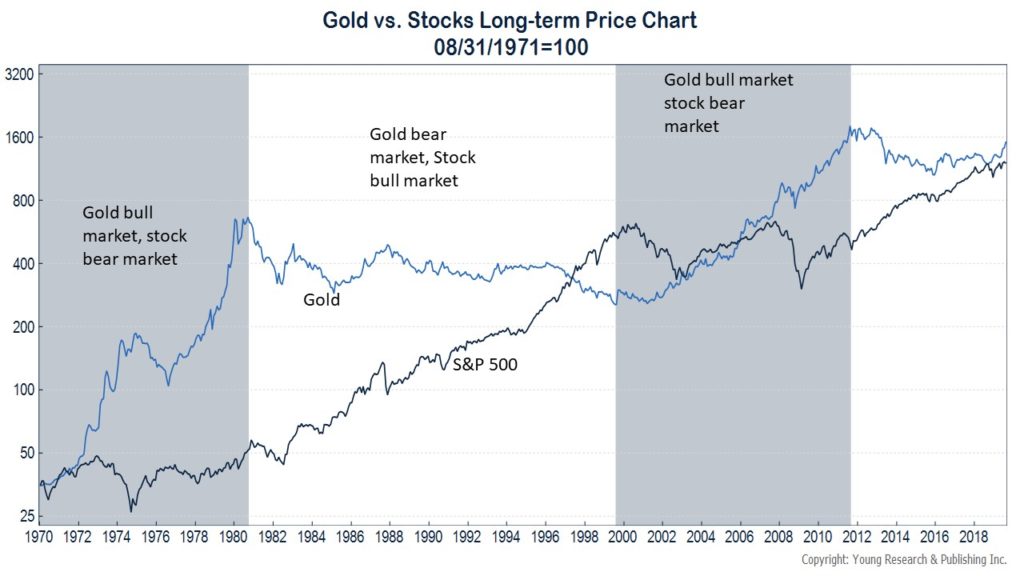
What should jump out at you from studying the table above is gold tends to move counter to stocks and bonds. At Young Research, we like to say that gold is the only investment we advise with the hope that it will fall in price. Why? Because as you can see in the table above when the price of gold is down, everything else in your portfolio is likely to be up. The 1980s and 1990s were a dismal time for gold, but they were boom times for stock and bond prices. Likewise, the 2000s were a great time to own gold, but stocks were down in price and bonds delivered modest returns.
The chart below on the long-term price of gold vs the S&P 500 reinforces this point over different periods. Gold bull markets tend to coincide with bear markets for stocks.

So what’s the verdict on Gold as a long-term investment? Gold has indeed been a good long-term investment and especially when held in conjunction with a stock and bond portfolio. And while gold’s future returns may not live up to its past performance, we would anticipate that gold will continue to perform well when stocks and bonds perform poorly.


