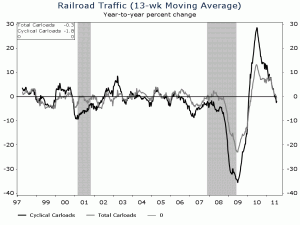
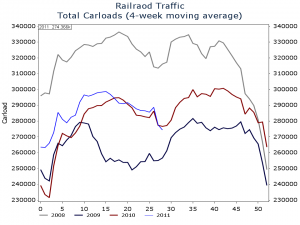
The Association of American Railroads (AAR) put out its weekly rail traffic report today. For the week ending July 16, total carloads fell 0.3% compared to the same week last year. The AAR’s weekly rail traffic data is famously noisy. To get a better read on the underlying trend in rail traffic, it is useful to adjust the data. In the first chart below, you are looking at the year-to-year rate of change of the 13-week moving average in both total carloads and cyclical carloads. Both series have dipped into negative territory. The next chart shows the four-week moving average of total carloads for each of the last four years. Rail traffic is now tracking below levels a year ago and far below 2008 levels. That’s not a bullish signal for economic growth.
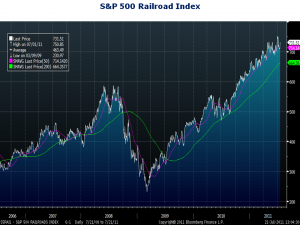
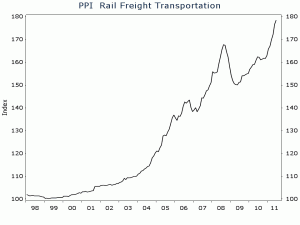
What isn’t tracking below 2008 levels is the S&P 500 Railroad index. Railroad stocks surpassed their 2008 highs in October of last year and have advanced 25% since. Union Pacific led the group higher today when it reported better-than-expected earnings. Why are rail shares advancing to new all-time highs when volume is still below 2008 levels? One big reason is pricing. The Producer Price Index for rail freight transportation is up almost 10% over the last year and over 60% since year-end 2003. If you are looking for an industry with pricing power, the rails have it.


