With a strong start out of the gates in 2013, U.S. stocks have now almost fully recovered from the devastating 57% plunge during the last bear market. Both the Dow and the S&P are once again bordering on all-time highs. Investors have long forgotten the dark days of the financial crisis. Fear is no longer the dominant theme on Wall Street. Greed is back in favor. Investors are convinced the next 50% move in stocks will be up rather than down.
To some, the strong performance of stocks over recent years seems puzzling. Economic growth is tepid, unemployment is still nearly 8%, and private-sector real incomes remain below pre-crisis highs. So how did stocks manage such an impressive recovery in the face of a slow economy?
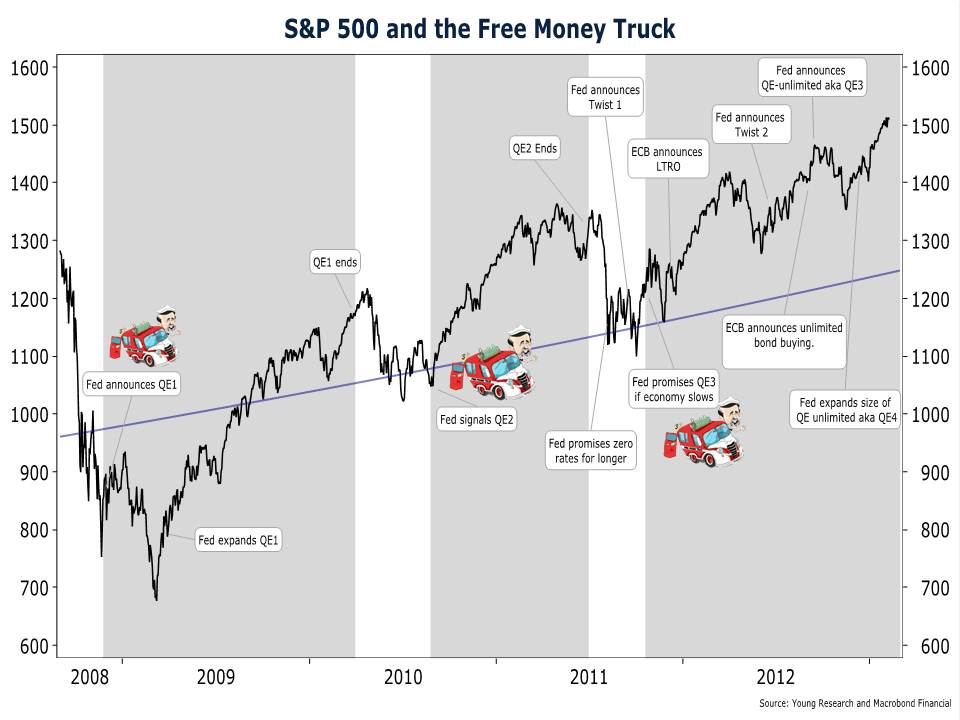
Our S&P chart below goes a long way to explaining the bull-run in stocks over the last four years. The black-line on the chart is the S&P 500. The blue-line on the chart is an approximation of the fair market value of the S&P 500. Our measure of fair value is simply the level of normalized earnings (we use trend earnings) multiplied by the historical median price-to-earnings ratio.

As you can see in our chart the blue line moves in a steady-eddy fashion from the lower left-hand side of the chart to the upper right hand side of the chart as trend earnings increase. In contrast, the S&P 500 fluctuates far above and below our fair value line.
If you study the chart carefully, the drivers of stock market performance become apparent. During the height of the crisis, the S&P 500 plunged far below fair value as investors anticipated the coming of the second great depression. As the financial system stabilized and the Fed flooded the system with liquidity, stocks quickly rose back to fair value.
 But since mid-2009 when stocks passed through fair-value, the story of the stock market has been one of monetary profligacy. From mid-2009 until mid-2010 stocks rode the Fed’s free money truck (QE1) to a level far detached from underlying fundamentals. The market cratered back to fair value as soon as Dr. Bernanke decided it was time to pull the free-money truck back into the garage.
But a plummeting stock market didn’t sit well with Dr. Bernanke so he fired-up the free money truck for another spin around Wall Street. On this second joy ride (aka QE2) Dr. Bernanke drove stocks even further away from fair value. And once again when the ride was over, the market sank back toward fair value.
A sinking market upset the apple cart at the Fed. After all, the stated purpose of first two trips in the free money truck (QE1 & QE2) was to inflate stock prices. So what did the Fed do? First they tried to prop up the market by promising to keep rates at zero for two years. Then they announced “operation twist” which called for extending the maturity of the Fed’s Treasury portfolio. Apparently those policy actions didn’t have the immediate impact on stock prices that the Fed was hoping for. So in the fall of 2011 the Fed signaled that a third round of money printing would be initiated as soon as U.S. economic growth slowed.
In December of 2011, the European Central Bank (ECB) made its own contribution to levitating stock prices with two massive money printing campaigns of its own. Once investors were convinced that the Fed and the ECB would initiate more money printing should economic growth slow, it was off to the races for stock prices. Since the Fed promised QE3 in late 2011—stock market corrections have been shallower and the deviations from fair-value have grown larger. Central bank intervention has also become more frequent. In mid-2012 after only a mini stock market correction the Fed announced Twist 2. Then the ECB announced unlimited bond buying. Not to be outdone by the ECB, the Fed followed up with its own unlimited money printing announcement only weeks later. And just to be sure it wasn’t outdone by the ECB, the Fed expanded the size of its unlimited money printing campaign at its December 2012 meeting.
Perpetual money printing campaigns by the Fed and its foreign counterparts have resulted in a widening disconnect between stock prices and fundamental values. At current levels, the S&P 500 is trading almost 20% above fair value. Where does the market go from here?
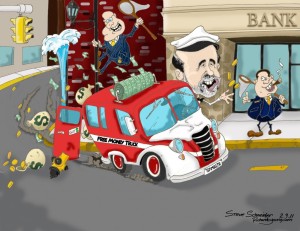
Let’s just say, here’s to hoping the free money truck doesn’t run out of gas!


