Housing market data released this week revealed a mixed bag. Home prices measured by FHFA were up 0.8% compared to the month before and the number of permits to build new homes increased more than expected. Meanwhile the number of housing starts was lower than expected. The volatile MBA Composite Applications index fell slightly, pulled in either direction by higher numbers of refinancing applications and lower numbers of applications for new home purchases. Monday’s survey of homebuilders recorded a slight improvement in their sentiment.
The housing market appears to be stuck in neutral. Our Rent-to-Price chart (Chart 1), comparing the affordability of renting a home to the price of building one infers that there is pent up demand for housing. As the saying goes, “Why rent when you can buy?” It is possible a lack of available credit is playing a role in allowing that number to move to its highest levels ever.
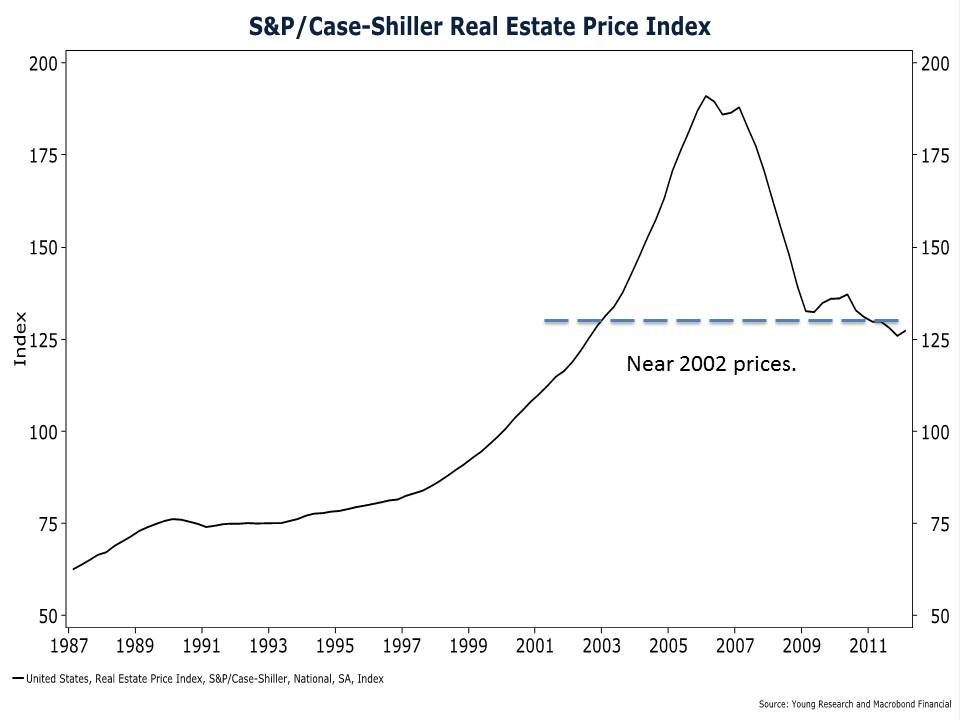
The S&P/Case-Shiller Real Estate Price Index (Chart 2) shows that home prices have begun to flatten out near their 2002 levels. But with homes still sitting on the market 58% longer than their historical average before the recession (Chart 3), perhaps prices need to come down more for the market to clear.


