Corporate profits hit another record last quarter. In its final revision of fourth quarter GDP, the Bureau of Economic Analysis reported the after-tax corporate profits increased to a record $1.25 trillion. Year-over-year profit growth was 13.7% in the fourth quarter and 3.3% on an annualized quarter-to-quarter basis.
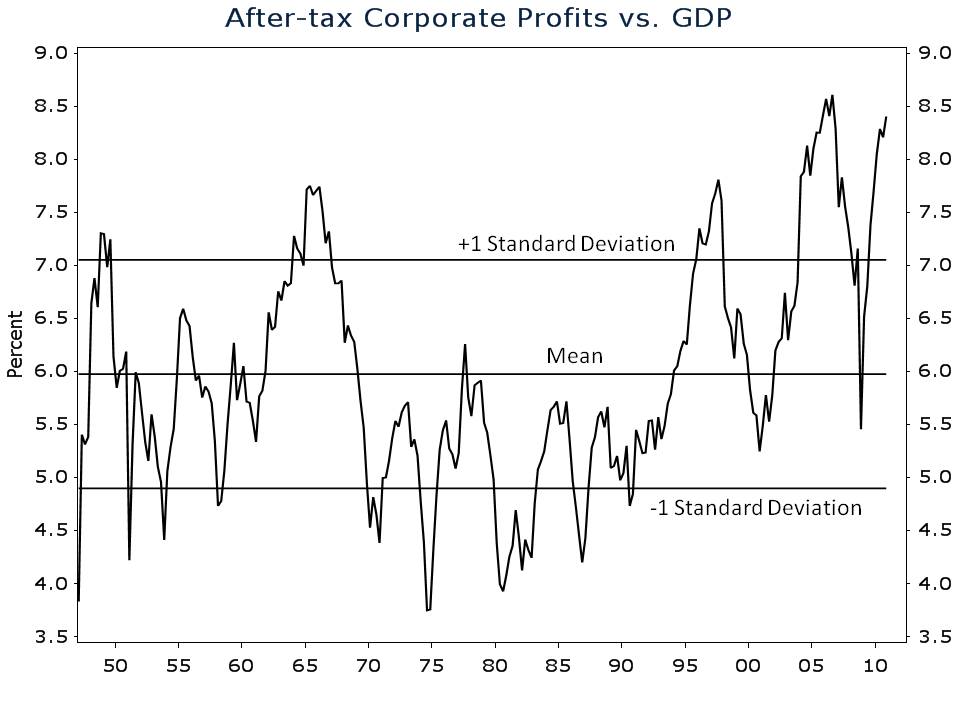
The corporate sector is one of the few bright spots in what has been one of the most lackluster economic recoveries on record. Corporate profits carved out an unmistakable V-shaped recovery—bottoming in the fourth quarter of 2008 and reaching a new high by the first quarter of 2010. An intense focus on costs enabled the strong recovery. Companies laid off employees and cut costs wherever possible. When demand stabilized, profit margins soared. As is evident in my chart below, profit margins, as measured by the ratio of after-tax corporate profits-to-GDP are near a record high.
My profit margin chart includes the historical mean and standard deviation. Over the last 60+ years, after-tax corporate profits have averaged 6% of GDP. The standard deviation of the series is about 1%. So assuming a normal distribution, you can say that 68% of the time, profit margins will be between 5% and 7%. Today the ratio of profits to GDP is 8.4%.
What do near-record profit margins signal for investors? They obviously signal strength in the corporate sector, but they also signal that profit growth is likely to slow in coming quarters. Profit margins have one of the strongest tendencies to mean revert, among time series in economics and finance. This is one of the defining characteristics of capitalism. Excess profits attract competition driving down profit margins.
When corporate profit margins are more than one standard deviation above their mean, or higher than 7%, the compound annual growth rate of profits over the following three years is 0.38%. Not so good when compared against the long-term historical average growth rate of more than 7%.
Now some may argue that the corporate profits figures reported by the Bureau of Economic Analysis are not the same as earnings per share (EPS) figures for the S&P 500. This is of course, true, but the implication of high profit margins on subsequent EPS growth is similar. When profit margins are higher than 7%, the median three year compound annual growth rate of S&P 500 EPS is 3.55% compared to a long-term average of 5.6% (I didn’t use the mean in this case because it was downwardly skewed by a few outliers. It is -2% for those of you who are interested).
Are stocks anticipating below average profit growth in coming years? Not if you believe the consensus EPS estimates for the S&P 500. According to Bloomberg, analysts are anticipating average annualized EPS growth of 12.6% over the next three years. Sounds like wishful thinking to me.
None of this is to say that corporate profit growth will slow in the next quarter or two. With the unprecedented amount of stimulus being injected into the economy, I wouldn’t be surprised to see profit growth accelerate over the next couple of quarters. And yes, the stock market may cheer on profit growth by rallying further, but for investors with an investment horizon longer than a few months, a defensive approach remains the prudent strategy.


